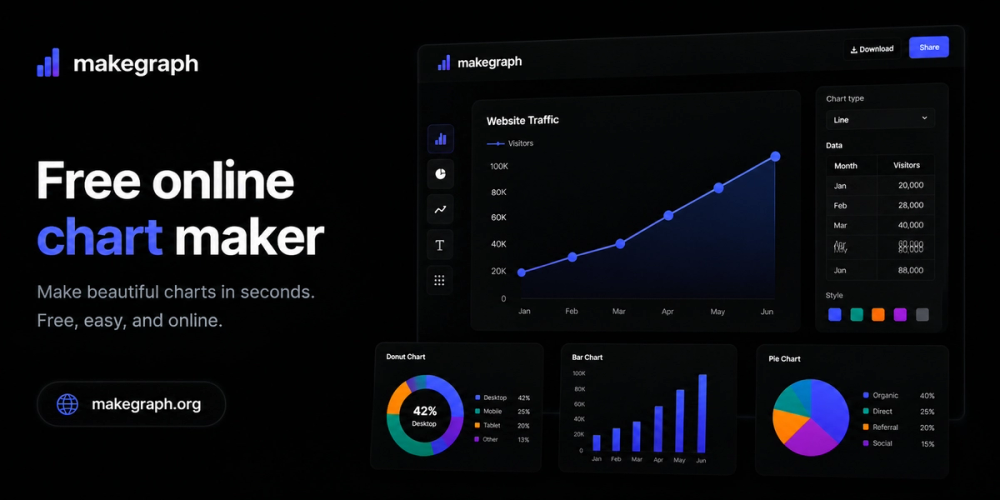
MakeGraph is a powerful and user-friendly online chart maker designed to transform your raw Excel or CSV data into visually appealing and insightful charts within minutes. This free tool eliminates the need for complex software or extensive design skills, making data visualization accessible to everyone.
Key Features:
- Effortless Data Import: Simply upload your Excel or CSV spreadsheet, or paste your data directly into the platform. MakeGraph intelligently processes your data, preparing it for visualization.
- Instant Chart Generation: In just one minute, you can generate a variety of professional-grade charts. The platform offers automatic chart suggestions based on your data, streamlining the creation process.
- Diverse Chart Types: MakeGraph supports a wide array of chart types to suit different data visualization needs:
- Line Chart: Ideal for plotting trends over time, allowing users to customize labels and colors for clear representation of data progression.
- Radar Chart: Perfect for comparing strengths across multiple dimensions, offering customizable labels and colors to highlight performance metrics.
- Bar Chart: Excellent for easily comparing categorical data, with options to customize labels and colors for impactful presentations.
- Bar Chart Race: A dynamic tool for animating rankings over time, enabling users to edit time-series data and preview smooth race playback for engaging visual storytelling.
- Double Bar Chart: Designed for comparing two distinct data sets side by side, providing customizable colors for clear comparative analysis in dashboards and presentations.
- Stacked Bar Chart: Useful for comparing totals and the composition of categories at a glance, with the flexibility to switch to 100% stacked views and customize colors for comprehensive reports.
- Customization Options: While offering instant generation, MakeGraph also provides options to customize chart elements such as labels, colors, and titles, ensuring your charts align with your branding or presentation style.
- High-Quality Export: Once your chart is ready, you can instantly export it in high-resolution PNG or scalable SVG formats, suitable for reports, presentations, websites, and print.
- Completely Free and No Registration Required: One of MakeGraph's most significant advantages is its accessibility. Users can create and export charts without any signup or registration process, making it a truly hassle-free solution.
Use Cases:
MakeGraph is an invaluable tool for:
- Business Professionals: Quickly create charts for business reports, investor presentations, marketing analysis, and sales performance tracking.
- Students and Researchers: Generate clear visualizations for academic papers, thesis presentations, and research findings.
- Data Analysts: Rapidly prototype and visualize data sets for initial insights and client reports.
- Marketers: Create compelling visuals for campaigns, social media content, and website infographics.
- Anyone needing quick data visualization: From personal projects to professional tasks, MakeGraph simplifies the process of turning numbers into understandable graphics.
By offering a fast, free, and intuitive platform, MakeGraph empowers users to transform complex data into clear, actionable visual stories, enhancing communication and decision-making.